
Why Market Timing Doesn’t Work
And What Smart Investors Do Instead
When markets start to fall, the urge to get out feels completely natural. It feels like the smart move — safe, proactive, in control. But the data tells a different story. Trying to time the market has historically cost investors far more than the drops they were trying to avoid. And it is not because people are bad at math. It is because markets do not move on our feelings.
Below, we break down why timing the market has rarely worked, what it actually costs, and what a smarter long-term approach looks like.
YOU HAVE TO BE RIGHT TWICE
Here is what most people miss about market timing: it is not one decision — it is two. You have to get the exit right. Then you have to get the re-entry right. Miss either one, and you have likely made things worse than if you had just stayed put.
“The best days in the market have historically clustered right around the worst days. Investors who step to the sidelines during a downturn often miss the first days of the recovery — and that is where most of the gains happen.”
— Crown Advisors Investment Team
Hypothetical Illustration: Think about a 58-year-old engineer who had worked hard and saved well for retirement. As scary headlines piled up in late February 2020, he moved his $500,000 portfolio to cash while markets were falling. By mid-March, his portfolio had dropped to about $380,000 — and that is when he sold, locking in the loss. Markets kept falling for a few more weeks, and he felt like he had made the right call. Then the S&P 500 came roaring back — one of the fastest recoveries in market history. He waited on the sidelines, waiting to feel safe again. By July 2020, he bought back in near the old highs — but with only $380,000 in cash. An investor who stayed the course saw their portfolio drop to a similar low — but recover to about $475,000 by that same July. Same starting point. Same storm. A gap of nearly $95,000 — just because one investor missed the recovery.
Disclosure
The example above is fictional and created for educational purposes only. It does not represent any real client, account, or investment result. The dollar figures are approximations based on general S&P 500 index movements during the stated period. Real results would differ based on timing, portfolio mix, fees, taxes, and other factors. Past market behavior is not a guide to future results.
THE RECOVERY MATH IS BRUTAL
Most people do not realize how long it takes to bounce back from a big loss. Losing 50% does not just need a 50% gain to break even — it needs a full 100% gain. That can mean years of going nowhere instead of growing.
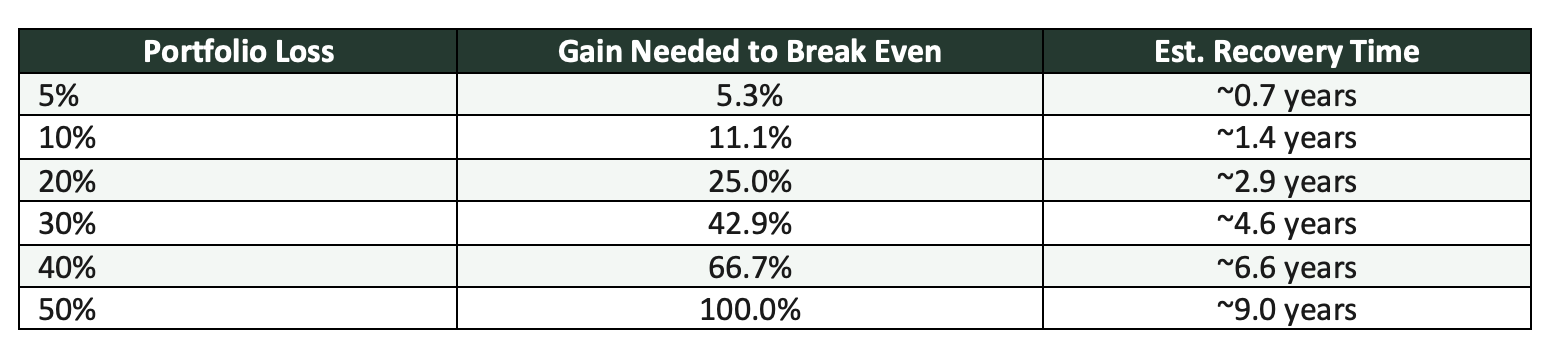
Table Assumptions & Disclosures
Recovery time estimates assume a steady 8% net annual growth rate from the point of loss. These figures are illustrative only and do not account for taxes, fees, inflation, or the real-world ups and downs of actual markets. Source: Aptus Research (illustrative methodology). Real recovery times will vary based on market conditions, how the portfolio is built, and when money is reinvested.
A 58-year-old who takes a 40% loss needs close to 7 years just to get back to where they started — and only if they reinvest at exactly the right time. The difference between a big loss and a smoother ride can mean the difference between retiring at 65 and working until 70.
Want to see how a market drop could affect your retirement timeline?
Start the conversation HERE
THE HIDDEN COST OF BIG SWINGS
Here is something that surprises many investors: your average return and your real return are almost never the same number. The bigger the ups and downs in your portfolio, the wider that gap gets. This is sometimes called volatility drag.
The table below shows four hypothetical portfolios, each starting with $100,000 over five years:

Disclosure — Volatility Table
All four portfolios are hypothetical and for educational purposes only. Assumptions: $100,000 starting value; 5-year period; no fees, taxes, or outside cash flows. Return sequences were built to show the stated averages with different levels of year-to-year swings. These do not represent any real investment strategy, fund, or client account. Real results will differ.
Portfolio D had the highest average return — 10.6% — but ended up with the lowest final value. Big swings hurt your ability to grow steadily. Meanwhile, boring, steady Portfolio B won the race with a lower average return.
Hypothetical Illustration: Two neighbors, both age 55, both starting with $200,000. The first investor averages 9% per year but with big swings. The second averages 7.5% with steadier returns. After five years, the second investor has about $287,000. The first has about $271,000 — less money, despite a higher average return.
Disclosure — Neighbor Scenario
This is a fictional example created for educational purposes only. It does not represent any real client, account, or investment strategy. Real results will differ based on market conditions, fees, taxes, and how the portfolio is built. Past performance is not a guide to future results.
The takeaway: big swings are not just uncomfortable. They have a real, measurable cost.
125 YEARS OF HISTORY: STAY INVESTED
More than a century of U.S. stock market data makes a strong case for staying invested. Decade by decade since 1900, the pattern has been remarkably consistent.
A simple formula helps explain where returns come from:
Dividends + Earnings Growth ± Change in Stock Valuations = Total Return
Dividends and earnings growth have driven more than 87% of long-term stock returns. The piece that market timers try to profit from — changes in how stocks are valued — has added only about 1.5% per year on average. And that only holds if you time it perfectly. Almost no one does. Miss a few of those big recovery days and the advantage disappears entirely.
Sources & Important Caveats
Return data referenced from Aptus Capital Advisors, drawing on research by John C. Bogle and Robert J. Shiller; data as of December 31, 2025. Figures reflect broad U.S. equity market history and are not tied to any specific index, fund, or portfolio. Numbers are approximations and will vary depending on the time period used. Past market behavior is not a guide to future results.
THE POWER OF PROTECTING THE DOWNSIDE
If timing the market has not worked, what has? One of the most powerful ideas in long-term investing is this: protecting against losses can be worth more than chasing gains. When you lose less, you need less to recover — and your money grows more smoothly over time.
Research has shown that a strategy capturing about 80% of the market’s gains but only 60% of its losses can come out ahead over the long run — simply because it avoids the painful climb back from deep drops.
Hypothetical Illustration: Two investors each start with $100,000 in January 2000. Investor A tracks a broad stock index fully — every gain, every loss. Investor B uses a hedged approach, capturing about 80% of the gains but only 60% of the losses.
Through the dot-com crash, Investor A’s portfolio fell to about $62,000 — a loss of more than a third. Investor B dropped to about $76,000. When 2008 hit, it happened again: Investor A fell to roughly $72,000. Investor B held above $97,000 — nearly $25,000 more in savings at the worst possible time.
That gap matters beyond the numbers. Investors with smaller losses are far less likely to panic and sell at the bottom — which is where most real-world wealth destruction happens. Over the 2000–2022 period, which included four major market drops, Investor B’s smoother ride produced a higher ending value of about $420,000 versus $405,000 for Investor A.
That said, during long bull markets — like 2023–2024 — full market exposure can pull ahead. There is no perfect answer. The hedged approach gives up some upside in exchange for real downside protection. Whether that trade-off is right depends on your timeline, how much risk you can handle, and how you would react to a major loss.
Disclosure — Hedged vs. Full-Market Example
"Investor A" and "Investor B" are fictional examples for educational purposes only. The 80%/60% capture rates are illustrative assumptions, not guaranteed results of any real strategy or product. The dollar figures are based on hypothetical calculations using approximate S&P 500 annual returns for the periods shown. They do not represent any real client account, fund, or investment product. Source concept: Bloomberg, Aptus Research (01/01/2000–12/31/2025). Past performance is not a guide to future results.
Curious how a well-built portfolio might work for you?
Start the conversation HERE
THE RISKS THAT ACTUALLY MATTER IN RETIREMENT
Even if timing the market worked — and history shows it has not — it would only fix one problem: short-term swings. The things that most often wreck retirement plans are bigger and last much longer.
1. Living Too Long: A 65-year-old couple today has about a 50% chance that one of them lives past age 90. (Source: Society of Actuaries, RP-2014 Mortality Tables with MP-2021 improvement scales.) Your money may need to last 25 to 30 years or more.
2. Inflation: At just 3% per year, $100,000 in buying power shrinks to about $74,000 in 10 years and roughly $41,000 in 30 years. People on fixed incomes feel this the most.
3. Taxes: The order in which you pull money from your accounts matters a lot. Getting it wrong can mean paying tens of thousands more in taxes over your lifetime than you need to.
4. Healthcare Costs: Medical costs have risen faster than general prices for decades. Long-term care is one of the biggest and least predictable expenses retirees face.
None of these risks go away by moving in and out of the market. They get solved by building a smart, flexible plan — and sticking to it.
THE BOTTOM LINE
More than 125 years of market data points to the same conclusion: the investors who came out ahead were not the ones who dodged every storm. They were the ones who built portfolios that could weather them.
At Crown Advisors, our job is not to predict the next market drop. It is to help you build a plan that does not depend on that prediction — one that can grow your money, protect it when times are tough, and adapt as your life changes.
“The goal is not to beat the market every year. The goal is to have enough — confidently, comfortably — for as long as you need it.”
— Crown Advisors Investment Team
Whether you are ten years from retirement or already in it, we would love to talk. Let’s look at where you are, where you want to be, and how to get there — without betting on anyone’s ability to time the market. Start the conversation HERE